
Energy, waste + reporting.
What federal labs and agencies report about cool roofs and construction waste, and how to turn roof decisions into numbers for a sustainability report. Every figure on this page is cited.
Jump to the energy estimator ↓Compare restoration vs. replacement costs →
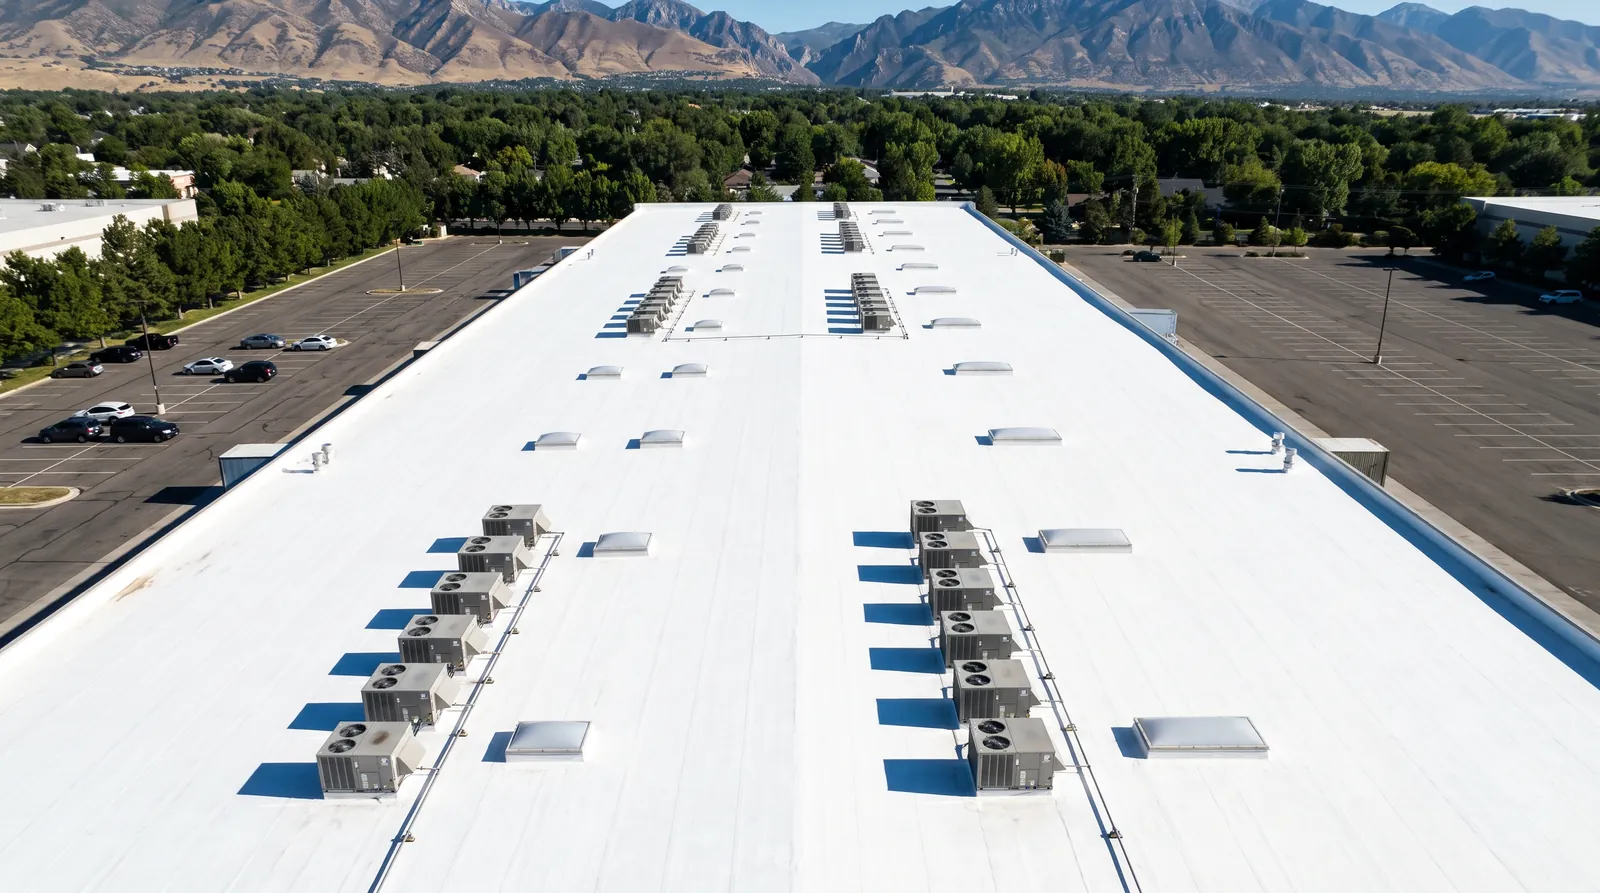
A reflective roof stays cooler.
On a typical summer afternoon, a clean white roof that reflects 80% of sunlight stays about 31°C (55°F) cooler than a gray roof that reflects only 20%, according to Lawrence Berkeley National Laboratory’s Heat Island Group.[1] ENERGY STAR cites the same group at about 50°F cooler.[2]
ENERGY STAR lists the benefits as lower air-conditioning costs, less strain on the grid at peak demand, lower emissions from building energy use, and slower roof degradation. It also notes cool roofs save the most in hot, sunny climates on buildings with low roof insulation.[2]
EPA lists liquid-applied roof coatings with light or cool colors among low-slope cool-roof products.[3] Rated products are listed in the Cool Roof Rating Council directory.[8]
Savings depend on the building. Model each one with the DOE Cool Roof Calculator,[7] then enter the result in our estimator.
White reflects. Dark absorbs.
Figures from Lawrence Berkeley National Laboratory, Heat Island Group[1]. Illustration, not to scale. Actual temperatures and savings depend on the building, climate and insulation.
Estimate cool-roof energy savings for your buildings
Enter one U.S. address or a whole portfolio. We look up each location, its local climate and its state energy prices, then apply the U.S. DOE / Oak Ridge National Laboratory Cool Roof Calculator method[7].
What a cool roof is for
Keeping the roof on the building.
EPA estimates 600 million tons of construction and demolition debris were generated in the United States in 2018, more than twice the amount of municipal solid waste. Just under 145 million tons went to landfills. Demolition is more than 90 percent of the total.[4]
A full tear-off removes the existing roof. Restoration, where a roof qualifies, keeps the existing assembly and removes only wet or damaged areas. The estimator turns your roof weight and wet-area share into a debris comparison for each building.
Keep the roof out of the waste stream.
National figures from U.S. EPA[4]. The roof bars are a schematic, not RC figures; use the estimator with your roof weight and wet-area share for a building-level number.
From kWh to emissions.
For greenhouse-gas reporting, avoided electricity is converted with an emission factor. EPA eGRID2023 lists the WECC Northwest (NWPP) subregion, which covers most of Utah, at 1,613 lb CO2 per MWh non-baseload (used for avoided emissions) and 632 lb per MWh total output (used for location-based reporting).[17] EPA’s equivalencies calculator uses a national rate of 6.72 × 10⁻⁴ metric tons per kWh.[5]
For dollars, the U.S. EIA reports the average Utah commercial electricity price at 10.85 cents per kWh in July 2026.[6] The estimator uses that as a default you can change.
Keep the inputs with the report: roof area, the reflectance of the old and new surfaces, the modeled kWh, the emission factor and its source. We can supply product data sheets and the written warranty for each coated roof.
Energy and sustainability questions
How much cooler is a white roof?+
Lawrence Berkeley National Laboratory reports that on a typical summer afternoon, a clean white roof that reflects 80% of sunlight stays about 31°C (55°F) cooler than a gray roof that reflects 20%. ENERGY STAR cites the Heat Island Group at about 50°F.
Does a cool roof save energy in Utah?+
ENERGY STAR says cool roofs save the most in hot, sunny climates on buildings with low roof insulation. Results vary by building, so model each one with the DOE Cool Roof Calculator.
How do I turn kWh saved into emissions for a sustainability report?+
Multiply kWh by an emission factor. For avoided emissions, EPA eGRID publishes a non-baseload rate for each subregion; most of Utah is in the WECC Northwest (NWPP) subregion, at 1,613 lb CO2 per MWh (eGRID2023). Location-based reporting uses the total output rate, 632 lb per MWh for NWPP. Use your utility's factor if your reporting method calls for it.
Does restoration reduce construction waste?+
A full tear-off sends the removed roof to disposal or recycling. Restoration keeps the existing assembly in place and removes only wet or damaged areas. EPA tracks construction and demolition debris nationally; see the figures on this page.
Sources and notes (22)
- Lawrence Berkeley National Laboratory, Heat Island Group. "Cool Roofs." https://heatisland.lbl.gov/coolscience/cool-roofs (accessed Oct 20, 2026)
- ENERGY STAR (U.S. EPA). "Cool Roofs." https://www.energystar.gov/products/roof_products/cool_roofs_emissivity (accessed Oct 20, 2026)
- U.S. EPA. "Using Cool Roofs to Reduce Heat Islands." https://www.epa.gov/heatislands/using-cool-roofs-reduce-heat-islands (accessed Oct 20, 2026)
- U.S. EPA. "Sustainable Management of Construction and Demolition Materials." https://www.epa.gov/smm/sustainable-management-construction-and-demolition-materials (accessed Oct 20, 2026)
- U.S. EPA. "Greenhouse Gas Equivalencies Calculator: Calculations and References" (national CO2 rate and 0.0053 t CO2 per therm of natural gas). https://www.epa.gov/energy/greenhouse-gases-equivalencies-calculator-calculations-and-references (accessed Oct 20, 2026)
- U.S. EIA. Electric Power Monthly, Table 5.6.A, Average Price of Electricity to Ultimate Customers by End-Use Sector, by State (Utah, commercial, July 2026). https://www.eia.gov/electricity/monthly/epm_table_grapher.php?t=epmt_5_6_a (accessed Oct 20, 2026)
- U.S. DOE / Oak Ridge National Laboratory. Cool Roof Calculator. https://coolroof.ornl.gov/ (accessed Oct 20, 2026)
- Cool Roof Rating Council. Rated Products Directory. https://coolroofs.org/directory/roof (accessed Oct 20, 2026)
- Levinson, R. and Akbari, H. (2010). "Potential benefits of cool roofs on commercial buildings." Energy Efficiency 3, 53–109. Lawrence Berkeley National Laboratory. (Weathered cool white SR 0.55 vs. weathered gray SR 0.20.) https://doi.org/10.1007/s12053-008-9038-2 (accessed Oct 20, 2026)
- NOAA Regional Climate Centers, Applied Climate Information System (ACIS) GridData web service, PRISM grid, annual cooling and heating degree days (base 65°F). https://www.rcc-acis.org/docs_webservices.html (accessed Oct 20, 2026)
- U.S. Census Bureau Geocoder (Public_AR_Current benchmark). https://geocoding.geo.census.gov/geocoder/ (accessed Oct 20, 2026)
- OpenStreetMap Nominatim (fallback geocoder; used under its usage policy, one request per second). Map tiles © OpenStreetMap contributors. https://operations.osmfoundation.org/policies/nominatim/ (accessed Oct 20, 2026)
- U.S. EIA. Natural Gas Prices, Utah, commercial price (July 2026: $8.57 per thousand cubic feet). https://www.eia.gov/dnav/ng/ng_pri_sum_dcu_SUT_m.htm (accessed Oct 20, 2026)
- U.S. EIA. Electric Power Monthly, Table 5.6.A (commercial sector, July 2026, all states and U.S. total). https://www.eia.gov/electricity/monthly/epm_table_grapher.php?t=epmt_5_6_a (accessed Oct 20, 2026)
- U.S. EIA. Natural Gas Prices, commercial price by state, annual 2025 (2024 where 2025 is not reported). https://www.eia.gov/dnav/ng/ng_pri_sum_a_EPG0_PCS_DMcf_a.htm (accessed Oct 20, 2026)
- U.S. EIA. FAQ: How much natural gas is used to generate a kilowatthour, and heat content (2025 U.S. average about 1,037 Btu per cubic foot). https://www.eia.gov/tools/faqs/faq.php?id=45&t=8 (accessed Oct 20, 2026)
- U.S. EPA. eGRID2023 Summary Tables (Revision 2, June 12, 2025), Table 1: subregion total output and non-baseload output CO2 emission rates. https://www.epa.gov/egrid/summary-data (accessed Oct 20, 2026)
- 10 CFR 431.97: minimum efficiency of commercial package air conditioners (e.g. EER 11.2 for 65–135 kBtu/h units from 2010; IEER 14.6 from 2023). https://www.ecfr.gov/current/title-10/chapter-II/subchapter-D/part-431/subpart-F/section-431.97 (accessed Oct 20, 2026)
- 10 CFR 431.77: commercial warm-air furnaces, minimum thermal efficiency 80% (81% from Jan 1, 2023). https://www.ecfr.gov/current/title-10/chapter-II/subchapter-D/part-431/subpart-D/section-431.77 (accessed Oct 20, 2026)
- 2024 IECC Table C402.1.3 (via UpCodes): insulation entirely above roof deck R-30ci in climate zones 4–6. https://up.codes/s/insulation-component-r-value-method (accessed Oct 20, 2026)
- U.S. Census Bureau. 2024 Gazetteer Files, places (coordinates for the ORNL calculator city list). https://www.census.gov/geographies/reference-files/time-series/geo/gazetteer-files.html (accessed Oct 20, 2026)
- NREL / OpenEI. U.S. Electric Utility Companies and Rates: Look-up by Zipcode (2023), IOU and non-IOU files, commercial average rate (CC BY 4.0). https://data.openei.org/submissions/6225 (accessed Oct 20, 2026)
- U.S. Department of Energy (2010). Guidelines for Selecting Cool Roofs. https://www1.eere.energy.gov/buildings/publications/pdfs/corporate/coolroofguide.pdf (accessed Oct 21, 2026)
- Petrie, T.W., Wilkes, K.E., Desjarlais, A.O. (2004). An Addition to the DOE Cool Roof Calculator. Oak Ridge National Laboratory, Buildings IX conference. https://web.ornl.gov/sci/buildings/conf-archive/2004%20B9%20papers/064_Petrie.pdf (accessed Oct 21, 2026)
- Christensen, C. and Wortman, D. Solar and internal gain adjustments in calculation of energy conservation savings (variable-base degree-day method). OSTI 5344868. https://www.osti.gov/biblio/5344868 (accessed Oct 21, 2026)
- NOAA National Weather Service. What Are Heating and Cooling Degree Days. https://www.weather.gov/key/climate_heat_cool (accessed Oct 21, 2026)
Book a multi-site roof assessment
Book the first building on our scheduling page. List the other sites in the notes field and we will plan the walk order with you. Questions? Call (801) 515-3812.
Book a roof assessment